Environment & Energy
Showing Original Post only (View all)The E/E pocket reference guide [View all]
Last edited Tue Feb 5, 2019, 09:20 PM - Edit history (21)
E/E invites discussion or any subject pertaining to the environment (biodiversity, pollution, GM crops, population et al); energy (fossil fuels, renewables, and the great nuclear pie-fight); and of course climate change/resource use which links the two. Peak oil related posts are also welcome, but don't forget the peak oil group.
If you've got questions about climate change feel free to ask, but if you repeatedly post denialist rubbish you are liable to be shown the door...
Updating Feb 2019 (Sorry for the wait. I've been tired and shagged out following a prolonged squawk).
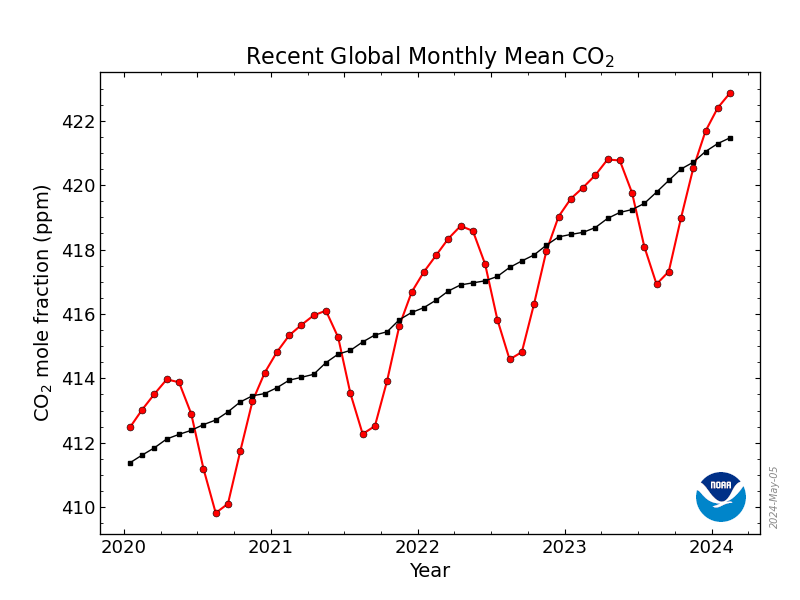
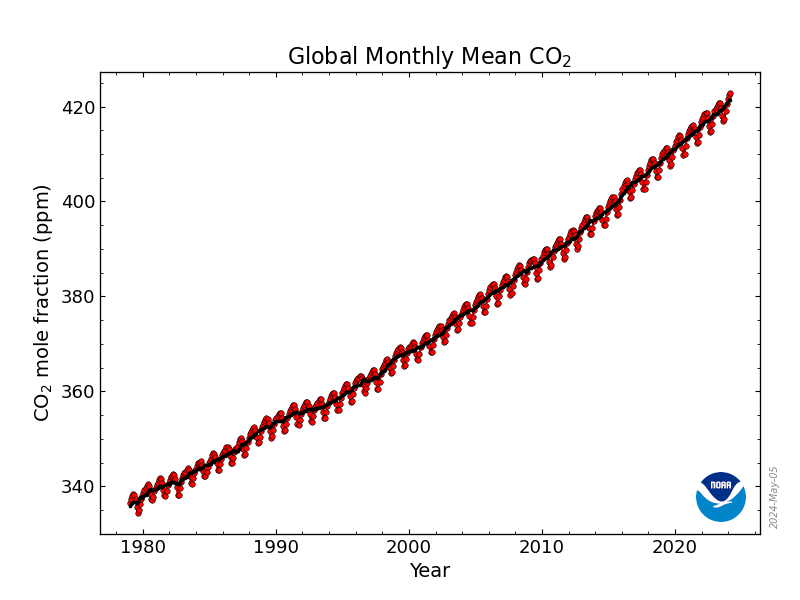
Carbon Dioxide
Carbon dioxide ( CO₂ ) is the GHG that gets discussed the most, because of the sheer amount we produce (9 billion tons in 2010) and because so much of our existing energy produces it. The best guess for a sustainable level is 350 ppm, so... Yeah. Good luck with that.
Short term trend (Source: NOAA):
Long term trend (Source: NOAA):
Emissions by region (Source: EIA):

Emissions by sector (Source: OWID)

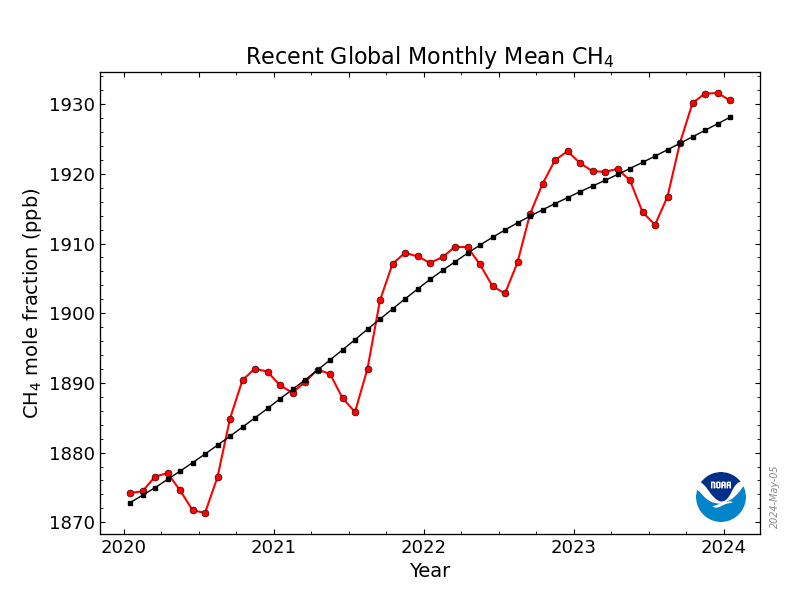
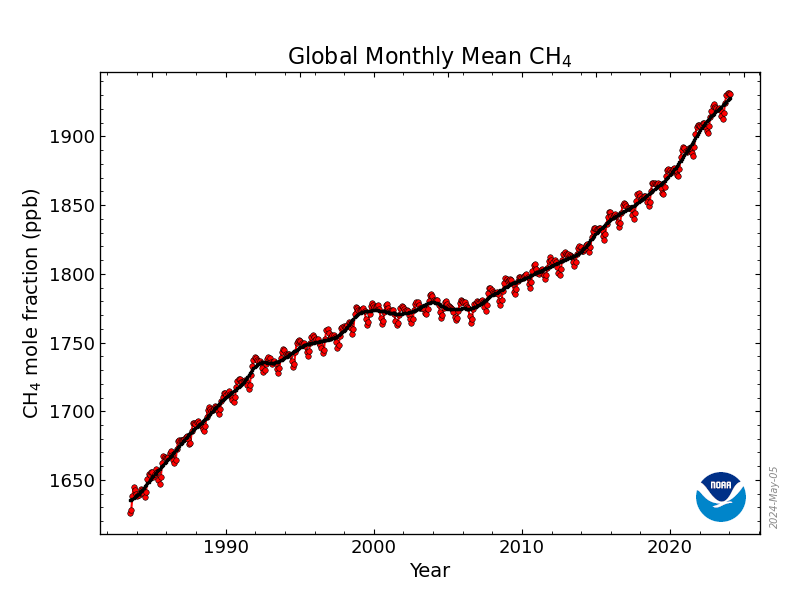
Methane
Methane ( CH₄ ) is a hundred times more potent (by mass) than CO₂ over a 20 year period: Although it does break down over time, the total amount in the atmosphere is increasing, largely due to melting clathrates in the oceans and permafront.
Short term trend (Source: NOAA)
Long term trend (Source: NOAA)
Other GHGs
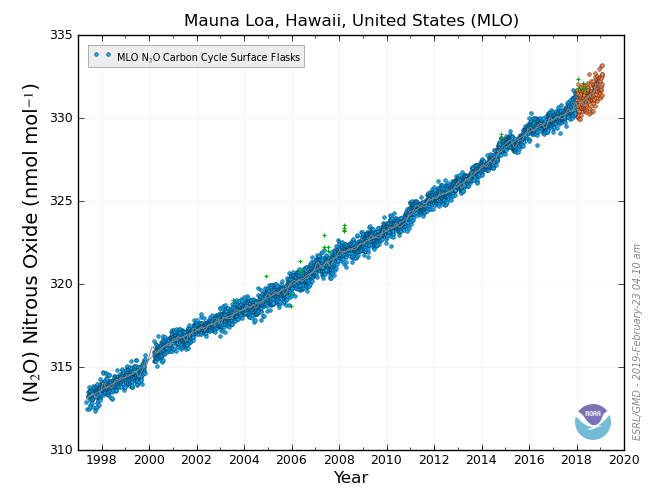
Nitrous Oxide (Source: NOAA)
N₂O is mainly released from fertilizer, is about 200 times more potent than CO₂, with a lifetime of ~120 years.
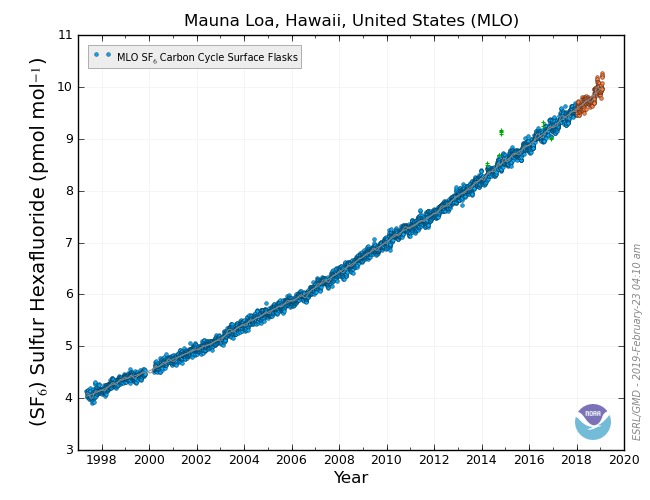
Sulfur Hexafluoride (Source: NOAA)
SF₆ is used in industry, is about 36,000 times more potent than CO₂, with a lifetime of ~6,000 years.
Current(ish) Temperature Anomalies:
Surface temperature (Source: NASA)

Ocean Heat Content (Source: NOAA)

The 'Hockey stick':
Source: The OSS Foundation
There are various versions of this chart: This is the from the last IPCC report, but there are more (with comparisons) at the link.
[div style="clear:both"]
[div style="width: 60%; float:right"] 
Realism vs Skepticism:
Source: Skeptical Science
Pwnd. Also check out Rasmus Benestad's trend-fudging masterclass at RealClimate.
[div style="clear:both"]
[div id="sechyd"][font size=4 ]Hydrology[/font]
[div style="width: 60%; float:right"] 
US Drought:
Source: UNL
[div style="clear:both"]
[div style="width: 60%; float:right"] 
Arctic ice area:
Source: UIUC
[div style="clear:both"]
[div style="width: 60%; float:right"] 
Arctic ice mass (PIOMAS):
Source: WashingtonU
[div style="clear:both"]
[div style="width: 60%; float:right"] 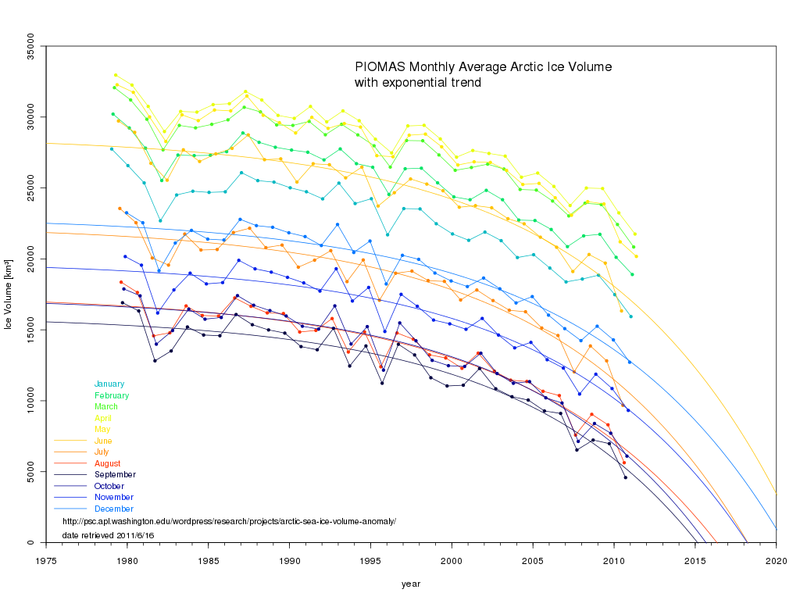
PIOMAS trends:
Source: Neven
Neven's Plot'o'Doom. Not guaranteed, but certainly food for thought.
[div style="clear:both"]
[div style="width: 60%; float:right"] 
Arctic ice map:
Source: UIUC
[div style="clear:both"]
[div style="width: 60%; float:right"] 
Antarctic ice map:
Source: UIUC
[div style="clear:both"]
[div id="secpal"][font size=4 ]Paleoclimate[/font]
[div style="width: 60%; float:right"] 
CO2 & Temp for 5 glaciations
Source: GWArt
[div style="clear:both"]
[div style="width: 60%; float:right"] 
Milankovitch cycles
Source: GWArt
NB: Recent is on the left.
[div style="clear:both"]
[div style="width: 60%; float:right"] 
CO2 & Temp for 4 glaciations
Source: VictoriaU
NB: Recent is on the left.
[div style="clear:both"]
[div id="secene"][font size=4 ]Energy[/font]
[div style="width: 60%; float:right"] 
US Energy flowchart - 2010
Source: LLNL
[div style="clear:both"]
[div style="width: 60%; float:right"] 
Global energy production - 1985 to 2010
Source: Consumer Energy Report
NB: The figures are from BP, but I assume they're accurate.
[div style="clear:both"]
[div style="width: 60%; float:right"]

Energy consumption by fuel - 1990 to 2035
Source: EIA
Many more at the link.
[div style="clear:both"]
[div id="secres"][font size=4 ]Responses to denialist claptrap[/font]
Claim: CO2 followed warming after the last ice age.
[div style="width: 60%; float:right"] 
Details: Rather than an increase in CO2 causing increasing temperatures at the end of the last ice, the increase in CO2 was caused by increasing temperatures. Therefore, we don't need to worry about increasing CO2 now.
Response: A test of 80 temperature proxies referenced against CO2 levels (from air trapped in ice) shows that the the CO2 definitely came first. A fuller explanation can be found at http://www.livescience.com/19481-ice-age-carbon-dioxide-orbit.html, and the paper is at http://www.nature.com/nature/journal/v484/n7392/full/nature10915.html
[div style="clear:both"]
(I'll add more of these next week ![]()
![]()
[div id="seclin"][font size=4 ]Links[/font]
RealClimate: Climate Science from climate scientists.
Skeptical Science: Examines the science and arguments of global warming skepticism.
The Oil Drum: Discussions about Energy and Our Future
Nevan's ice blog.
GliderGuider's happy fun pages.
[div style="width: 60%; float:left"] 
[div style="clear:both"]