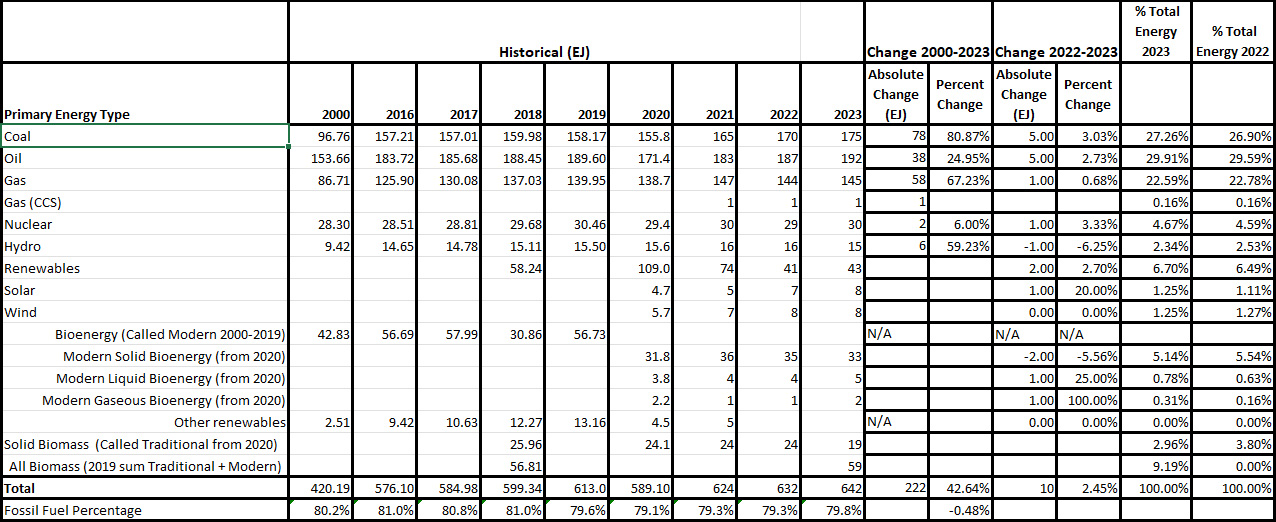
Table of EIA WEO Energy Sources in Exajoules, 2000, 2016-2023
I have every annual issue of the IEA's World Energy Outlook in my files going back to 2009, and in addition those of 1995, 2000, 2006, 2007.
From back issues of the World Energy Outlook, I have prepared the following table of data (as opposed to soothsaying, which the WEO always includes), showing changes in overall energy consumption by primary energy source type.
There have been changes, obviously, in the way energy is reported, for example, the useless solar and wind industries - useless in the sense that they have done zero, nada, zilch to slow extreme global heating - were reported combined in the 2000 edition as "other renewables." The precision of the reported totals has also changed, and error bars are not reported. However, my tables of data should speak for themselves. The world is pretty much as dependent, in "percent talk" on fossil fuels as it was in the year 2000, but the absolute numbers have all changed for the worse. Since 2000, world energy demand has risen by 222 Exajoules; so much for the promises of bourgeois shit for brains antinuke Amory Lovins.
Years ago, the table reported energy production in units of "MTOE," "million tons of oil equivalent," having switched to the SI unit Exajoule in recent years. In the table all numbers have been converted using the conversion factor 1 MTOE = 0.0419 EJ and are reported in EJ.
The table:

It should speak for itself.
Enjoy the last Thanksgiving under the soon to disappear US Constitution.
