National Snow and Ice Data Center: 2024 Antarctic sea ice maximum extent finishes at second lowest
https://nsidc.org/sea-ice-today/analyses/2024-antarctic-sea-ice-maximum-extent-finishes-second-lowest2024 Antarctic sea ice maximum extent finishes at second lowest
THURSDAY, OCTOBER 3, 2024
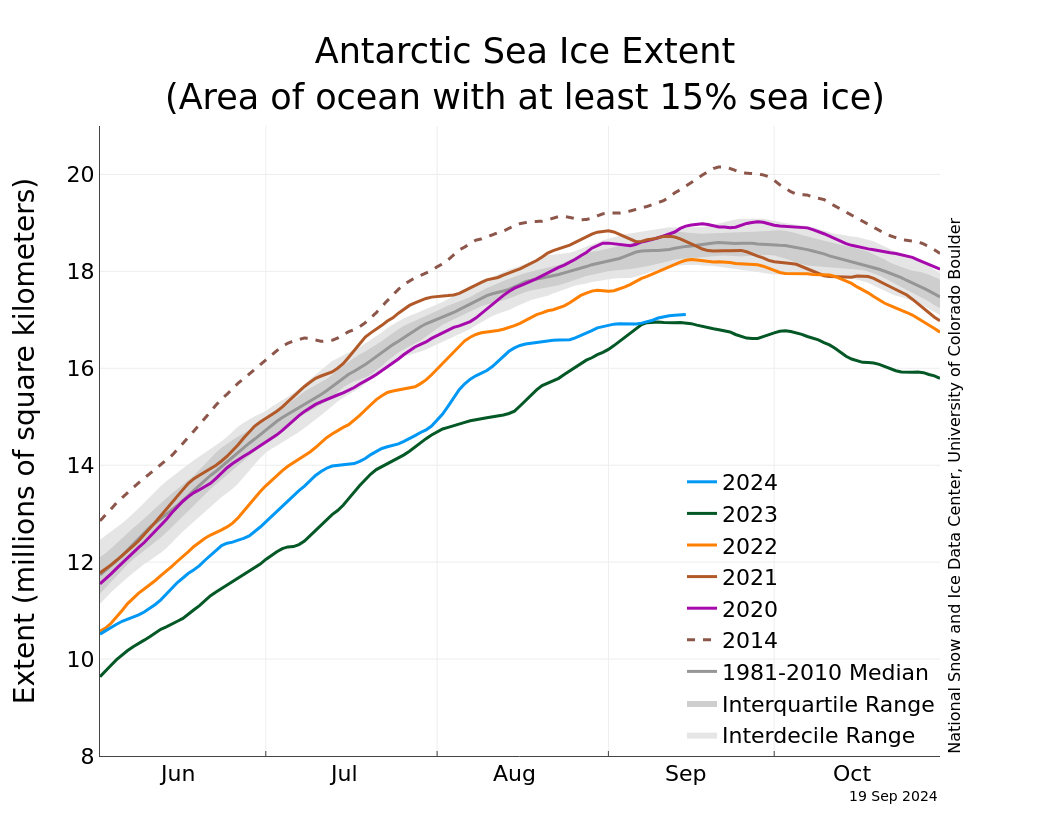
On September 19, Antarctic sea ice likely reached its annual maximum extent of 17.16 million square kilometers (6.63 million square miles). The 2024 maximum is the second lowest in the 46-year satellite record above only 2023. There is some uncertainty in the extent and date due to the loss of input source data around the time of the maximum.
Overview of Conditions
On September 19, 2024, Antarctic sea ice stalled out at an annual maximum extent of 17.16 million square kilometers (6.63 million square miles), the second lowest maximum in the satellite record that began in 1979 (Figure 1a). This year’s maximum is 200,000 square kilometers (77,000 square miles) above the previous record low set in 2023. It is 1.55 million square kilometers below (598,000 square miles) below the 1981 to 2010 average Antarctic maximum extent. Sea ice extent is markedly below average in the Indian Ocean. Extent is above average stretching out of the Amundsen Sea. This sea ice pattern is similar to last year’s record low (Figure 1b).
The Antarctic maximum extent is four days earlier than the 1981 to 2010 median date of September 23. The interquartile range for the date of the Antarctic maximum is September 18 to September 30.
There is also some uncertainty in the estimate and date of the maximum because of an outage in the input source data from September 12 to 18. The September 19 value is the highest extent in the five-day average estimates. However, this is the first valid value after the input data stream was restored. So, it is possible that the maximum actually occurred during the data outage. Also, our five-day average allows for some missing data and requires a minimum of two days of data to calculate an average. This was the case for the September 19 estimates. There is greater uncertainty as well with only partial data used for the five-day average. The highest date with a complete five days of data is September 23, which has a value of 17.13 million square kilometers (6.61 million square miles). This is slightly below the September 19 value, but given the uncertainty range of the values, it does affect the ranking or long-term trends.
 Figure 1a. The map on the left shows Antarctic sea ice extent for September 19, 2024, which was 17.16 million square kilometers (6.63 million square miles). The orange line shows the 1981 to 2010 average extent for that day. Figure 1b. The map on the right compares Antarctic sea ice extent for September 19, 2024, in blue, with the record low maximum from last year on September 10, 2023, in white. — Credit: National Snow and Ice Data Center
…
 Figure 2. The graph above shows Antarctic sea ice extent as of September 19, 2024, along with daily ice extent data for four previous years and the record-high maximum year. 2024 is shown in blue, 2023 in green (record-low maximum), 2022 in orange, 2021 in brown, 2020 in magenta, and 2014 in dashed brown. The 1981 to 2010 median is in dark gray. The gray areas around the median line show the interquartile and interdecile ranges of the data. — Credit: National Snow and Ice Data Center
…

